


Technical analysis in foreign exchange market
 Historically, the technical analysis in the open markets used six variables on certain timeframes of exchange rate data: opening price, peak, trough, closing, volume and general interest.
Technical analysis consists firstly, in a variety of technical studies that can be interpreted into determining where the market is headed or into forecasting the sell or buy signals. The common element of the technical studies is price/time chart that identifies the trends of currency prices.
The difference between technical analysis and fundamental analysis is that technical analysis ignores the fundamental factors and applies only to the action of the price in a market.
Technical analysis is based on the evaluation and instinctive feel in predicting the future trends as to inferring the future price changes from those of the recent past. As technical analysts say, these trends repeat themselves regularly and lead to similar behavior. Some of them predict price decline, while other signal it’s time to buy.
Some charting methods can predict the size of possible gains or decreases. Unlike the fundamental analysis that evaluates the general market condition, the technical analysis is used to guide trading decisions and to predict the best time to buy, according to X-Trade Brokers Romania.
Thus, there are three principles that vector the technical analysis
- The market absorbs all factors that influence the prices
- Prices depend on trends
- history repeats itself: the charts reveals price patterns in the data
Line chart
 X-Trade Brokers say this is the most basic charting-based tool to represent the price evolution. The line is formed by connecting the dots in a range of data. The dots may represent the opening prices, on peaks and troughs, or closing prices. The most commonly used are the closing prices, considered to be the most relevant.
 The main advantage is the simplicity and its drawback is the lack of details over the time frame represented by one dot.
.jpg)
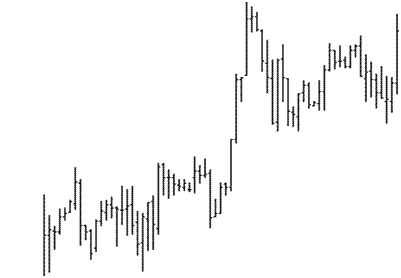
Bar chart
 The bar charts are built to provide more key pieces of information over a period of time, reveals X-Trade website.
The bar chart is made up of the trough and peak values over a trading period, opening value illustrated by a horizontal line in left side of the bar, and the closing value, represented by horizontal line located in the right side of the bar.
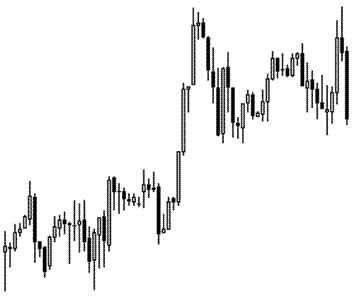
Candlestick chart
 This type of graphic offers a more complete range of data over a specific time frame.
 The chart is made up of a rectangle that represents the difference between opening price and closing price as well as lines representing the peak and trough values over a trading period.
In order to have a better image on price evolution, the colors representing the growth trends are differently colored from downtrends. Black/white, green/red are the most commonly used colors to indicate growth/decline.
Point and figure chart
 For “technical traders” the most important thing is to determine the market trend. The trend lines are drawn by linking the successive highs/lows, say the specialists of the brokerage firm.
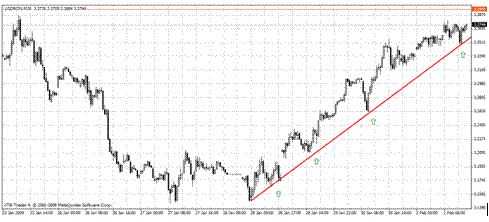
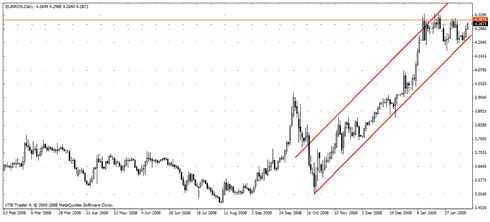
Trend channel chart
 Trend channel chart offers the possibility of determining a trend in a channel.
In order to offer the example of a channel trend, we will take for example an upward trend. The uptrend line is drawn by linking the local troughs and then a parallel line that will intersect one or more local peaks.
If return lines break out of the channel line, it is a sign of the current growing trend. For the example above, if the lower channel lines are broken out, it is a sign of a trend reversal, and if the upper channel lines are broken out, it is a sign the current trend is accelerating.
Support and resistance
 Both support and resistance are drawn by linking the price levels through which a currency falls or surpasses. Usually, when the support or resistance level is broken, its role is reversed.
The support line is determined by a value below which the price cannot usually fall. It is seen as a level at which the traders are willing to buy. If the price falls below the support value, it will afterward be tested. The support may be confirmed if the price comes back on up or tested if the level can be broken, turning into resistance.
.jpg)

![HR [PLAY] Tech Workout - 11...](https://www.wall-street.ro/image_thumbs/thumbs/973/973fe0a3888d417feff63de42e814180-260x260-00-65.jpg?v=1713519618)