


Bar chart
The bar charts are built to provide more key pieces of information over a period of time, reveals X-Trade website.
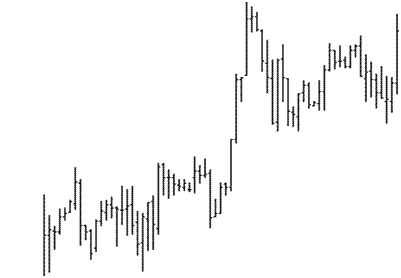
The bar chart is made up of the trough and peak values over a trading period, opening value illustrated by a horizontal line in left side of the bar, and the closing value, represented by horizontal line located in the right side of the bar.
The bar chart is made up of the trough and peak values over a trading period, opening value illustrated by a horizontal line in left side of the bar, and the closing value, represented by horizontal line located in the right side of the bar.