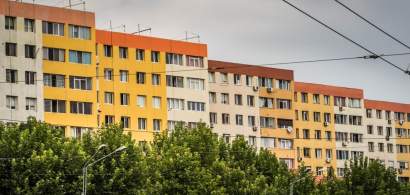


Cartierele cu cele mai mari creșteri de prețuri la apartamente noi în perioada pendemiei
| Apartamente noi | Apartamente vechi | Per total | |||||||
|---|---|---|---|---|---|---|---|---|---|
| Zonă | Ian 2020 | Mai 2020 | Ev. | Ian 2020 | Mai 2020 | Ev. | Ian 2020 | Mai 2020 | Ev. |
| Ștefan Cel Mare | 1.778 | 2.317 | 30,3% | 1.447 | 1.559 | 7,7% | 1.534 | 1.607 | 4,8% |
| Moșilor | 1.687 | 2.020 | 19,7% | 1.405 | 1.402 | -0,2% | 1.416 | 1.426 | 0,7% |
| Giurgiului | 974 | 1.083 | 11,2% | 1.043 | 1.052 | 0,9% | 1.041 | 1.057 | 1,5% |
| Drumul Taberei | 980 | 1.086 | 10,8% | 1.100 | 1.134 | 3,1% | 1.090 | 1.119 | 2,7% |
| Decebal-Calea Călărașilor | 1.710 | 1.817 | 6,3% | 1.700 | 1.722 | 1,3% | 1.705 | 1.739 | 2,0% |
| 13 Septembrie-Panduri | 1.460 | 1.548 | 6,0% | 1.266 | 1.276 | 0,8% | 1.286 | 1.321 | 2,7% |
| Rahova | 908 | 962 | 5,9% | 1.023 | 1.033 | 1,0% | 1.000 | 1.013 | 1,3% |
Sursa foto: Gabriel Petrescu / Shutterstock
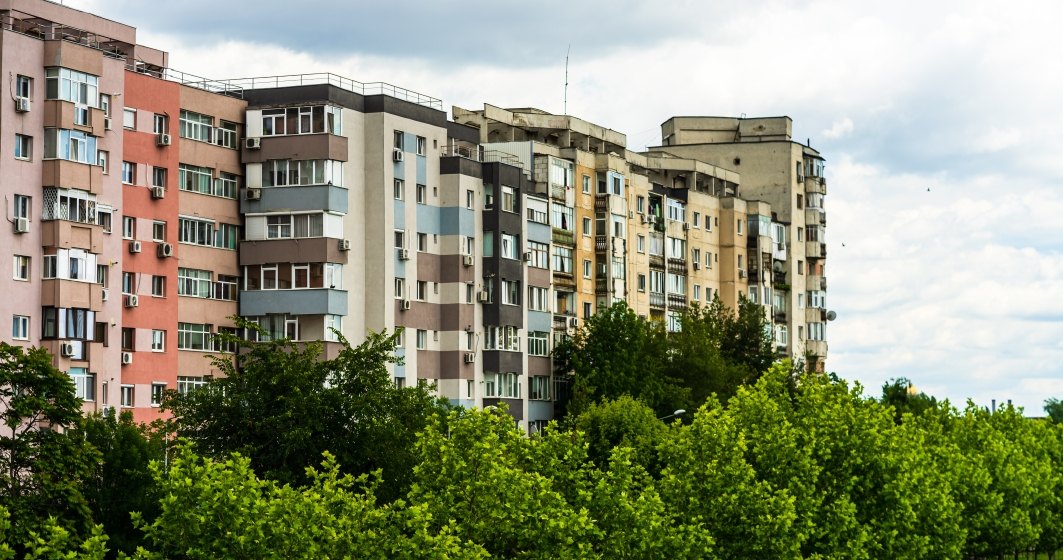
Cartierele unde avansul prețurilor la apartamente noi și-a păstrat ritmul în vreme de Covid-19
| Apartamente noi | Apartamente vechi | Per total | |||||||
|---|---|---|---|---|---|---|---|---|---|
| Zonă | Ian 2020 | Mai 2020 | Ev. | Ian 2020 | Mai 2020 | Ev. | Ian 2020 | Mai 2020 | Ev. |
| Victoriei-Romană-Universitate | 2.435 | 2.542 | 4,4% | 1.671 | 1.684 | 0,8% | 1.790 | 1.786 | -0,2% |
| Pipera | 1.500 | 1.558 | 3,9% | 1.634 | 1.813 | 11,0% | 1.500 | 1.560 | 4,0% |
| Giulești | 1.049 | 1.085 | 3,4% | 1.101 | 1.000 | -9,2% | 1.060 | 1.085 | 2,4% |
| Colentina | 1.047 | 1.079 | 3,1% | 1.184 | 1.192 | 0,7% | 1.123 | 1.143 | 1,8% |
| Herăstrău-Nordului | 2.724 | 2.807 | 3,0% | 2.644 | 2.433 | -8,0% | 2.712 | 2.755 | 1,6% |
| Bucureștii Noi | 1.337 | 1.372 | 2,6% | 1.284 | 1.310 | 2,0% | 1.325 | 1.340 | 1,1% |
| Pantelimon | 1.157 | 1.186 | 2,5% | 1.136 | 1.182 | 4,0% | 1.136 | 1.182 | 4,0% |
Sursa foto: Vlad Ungurianu / Shutterstock
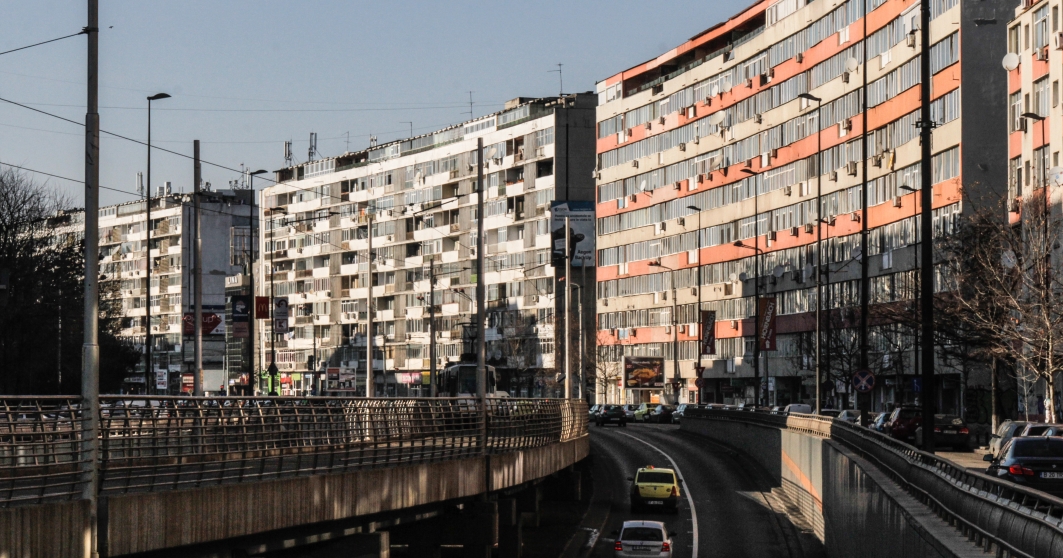
Cartierele în care prețurile la apartamente noi au stagnat mai mult sau mai puțin în perioada Covid-19
| Apartamente noi | Apartamente vechi | Per total | |||||||
|---|---|---|---|---|---|---|---|---|---|
| Zonă | Ian 2020 | Mai 2020 | Ev. | Ian 2020 | Mai 2020 | Ev. | Ian 2020 | Mai 2020 | Ev. |
| Unirii | 1.851 | 1.875 | 1,3% | 1.857 | 1.777 | -4,3% | 1.853 | 1.806 | -2,5% |
| Militari | 930 | 942 | 1,3% | 1.167 | 1.200 | 2,8% | 1.014 | 967 | -4,6% |
| Tineretului-Timpuri Noi | 1.917 | 1.936 | 1,0% | 1.618 | 1.639 | 1,3% | 1.623 | 1.664 | 2,5% |
| Berceni | 1.095 | 1.100 | 0,5% | 1.179 | 1.206 | 2,3% | 1.150 | 1.154 | 0,3% |
| Ghencea | 867 | 868 | 0,1% | 1.010 | 941 | -6,8% | 868 | 870 | 0,2% |
Sursa foto: Radu Bercan / Shutterstock
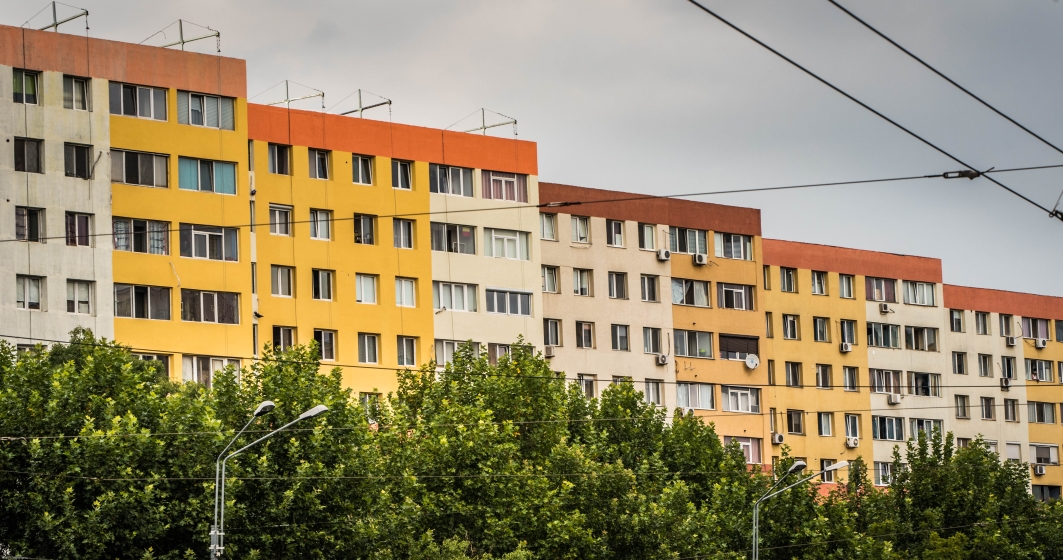
Cartierele din București unde prețul la apartamente noi a scăzut ușor în vreme de pandemie
| Apartamente noi | Apartamente vechi | Per total | |||||||
|---|---|---|---|---|---|---|---|---|---|
| Zonă | Ian 2020 | Mai 2020 | Ev. | Ian 2020 | Mai 2020 | Ev. | Ian 2020 | Mai 2020 | Ev. |
| Băneasa | 1.701 | 1.695 | -0,4% | 1.667 | 1.727 | 3,6% | 1.689 | 1.701 | 0,7% |
| Aviației | 2.175 | 2.133 | -1,9% | 2.029 | 2.051 | 1,1% | 2.053 | 2.097 | 2,1% |
| Iancului-Mihai Bravu | 1.597 | 1.566 | -1,9% | 1.363 | 1.441 | 5,7% | 1.463 | 1.491 | 1,9% |
| Griviței-Gara de Nord | 1.577 | 1.524 | -3,4% | 1.225 | 1.250 | 2,0% | 1.239 | 1.254 | 1,2% |
Sursa foto: Adriana Sulugiuc / Shutterstock
Cartierele cu cele mai mari scăderi de prețuri la apartamente noi în vreme de pandemie
| Apartamente noi | Apartamente vechi | Per total | |||||||
|---|---|---|---|---|---|---|---|---|---|
| Zonă | Ian 2020 | Mai 2020 | Ev. | Ian 2020 | Mai 2020 | Ev. | Ian 2020 | Mai 2020 | Ev. |
| Titan | 1.172 | 1.116 | -4,8% | 1.250 | 1.294 | 3,5% | 1.240 | 1.262 | 1,8% |
| Dristor-Vitan Vechi | 1.631 | 1.550 | -5,0% | 1.377 | 1.391 | 1,0% | 1.434 | 1.407 | -1,9% |
| Vitan Nou | 1.986 | 1.859 | -6,4% | 1.545 | 1.553 | 0,5% | 1.625 | 1.555 | -4,3% |
| Dorobanți-Floreasca | 2.545 | 2.367 | -7,0% | 2.074 | 2.036 | -1,8% | 2.268 | 2.175 | -4,1% |
| Tei | 1.936 | 1.798 | -7,1% | 1.252 | 1.318 | 5,3% | 1.350 | 1.400 | 3,7% |
Sursa foto: Adriana Sulugiuc / Shutterstock
Sursa foto: Vlad Ispas / Shutterstock